Generate subscription reports
As we know, understanding how our business is going, and where it is going, is key to success. And particularly so when we offer subscription services or products.
Before getting to the heart of the matter, it is very important to recall certain essential concepts to the proper understanding of the following reports:
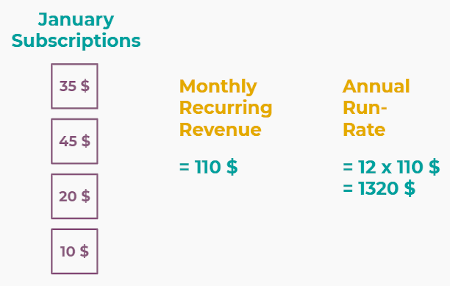
Monthly Recurring Revenue (MRR): MRR is arguably the most important metric for subscription businesses. It shows the monthly revenue earned with subscription-based products or services. It is a consistent number used to track all recurring revenue over time, in monthly increments.
Annual Run-Rate (ARR): ARR is the yearly version of MRR, which is based on the current MRR, to estimate the coming year’s performance. However, this estimation does not take variations and growth into account.
Non-Recurring Revenue (NRR): NRR shows the revenue earned for everything else than subscription-based products or services. This includes gains of a rare or unique nature that are unlikely to occur in the ordinary course of businesses.
Customer Retention: Practices to engage existing customers to continue buying products or services from your business. Customer retention can be a challenge, because you must prove you are worthy of your customers’ trust.
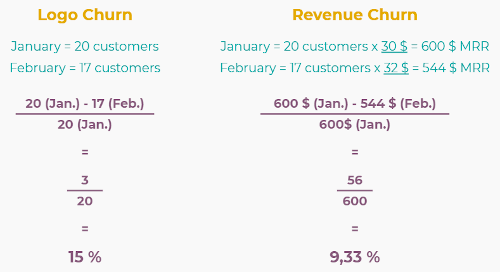
Churn Rate: Also known as the Rate of Attrition or Customer Churn, the churn rate can be defined, in this case, as the percentage of subscribers who discontinued their subscriptions within a given time period. We can distinguish two types of Churn:
Logo Churn: It corresponds to the subscription cancellation rate.
Revenue Churn: It corresponds to the monthly recurring revenue loss rate.
Example
Let’s imagine a 2$ increase in a subscription service.
We lost 3 customers out of the initial 20, which generates a Logo Churn of 15%.
- Therefore, the ₦56 of MRR difference out of the initial ₦600 causes a Revenue Churnof 9,33%.
Reminder: even though they seem to evolve in the same direction most of the time, it might not be the case all the time.
Customer Lifetime Value (CLV): Indicates how much revenue can be expected for a customer during his/her entire contract. This approach emphasizes the importance of customer retention, shifting our focus from a quarterly or yearly approach to a long-term one.
Check out the different kinds of reports you can access from the Juniper Subscriptions application.
Subscriptions analysis report
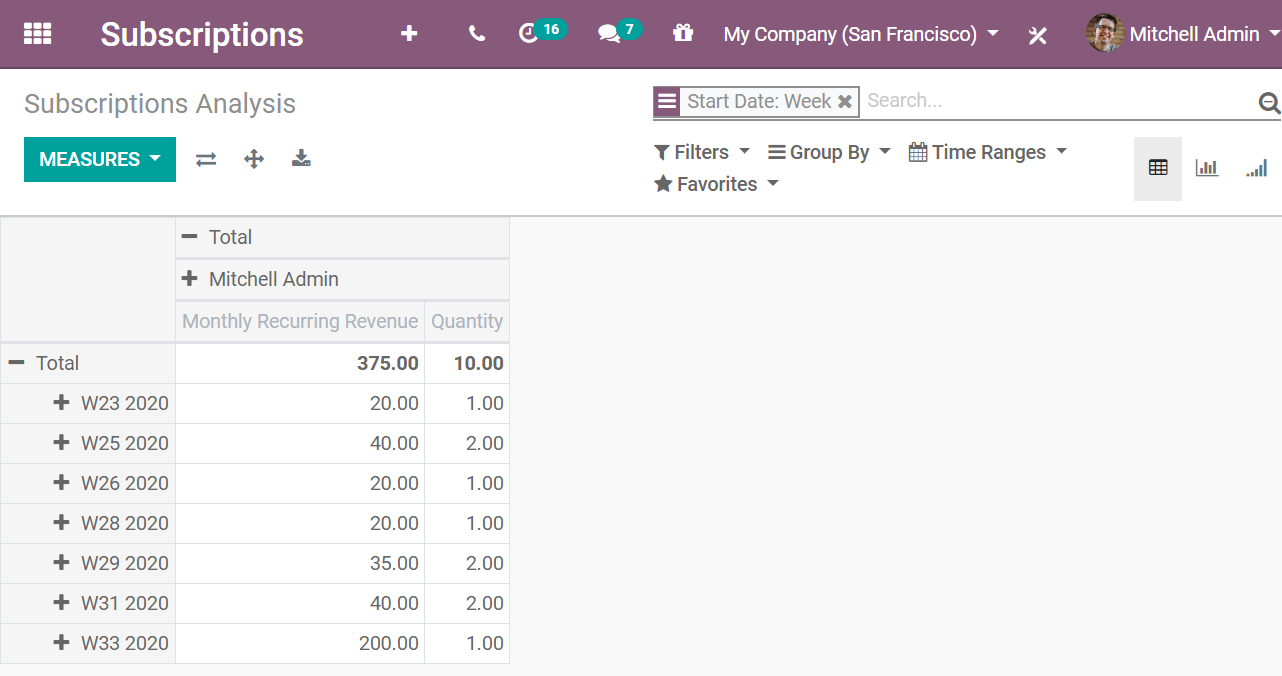
Go to . From there, you can change the Measures. By default, Juniper uses the Monthly Recurring Revenue. In addition to that, you can choose Quantity, Recurring Price, Yearly Recurring Revenue and Count. For this example, Quantity is added. This way, you can review both of these measures at the same time. You can even Group By Start Date and, more precisely, by Week, to get a clear view of your report.
Retention analysis report
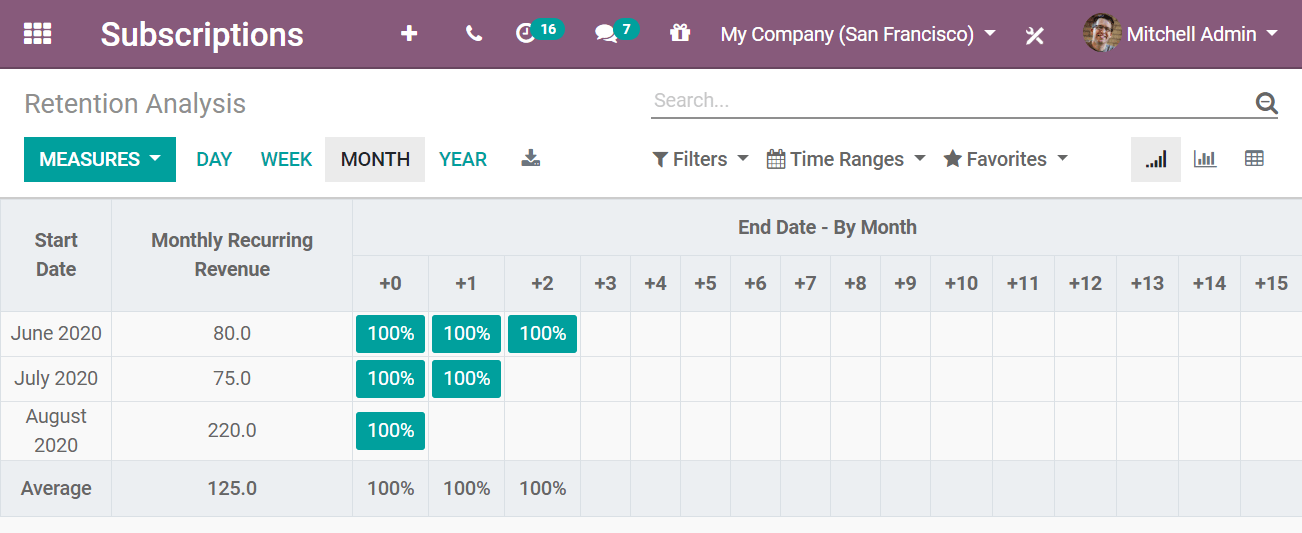
Go to . The default measure applied is Count, but you can change to the appropriate one for you. For the example below, Monthly Recurring Revenue was chosen, and the Month periodicity remains intact. By using these criteria, you can see the progression of the retention from its start.
Revenue KPIs report
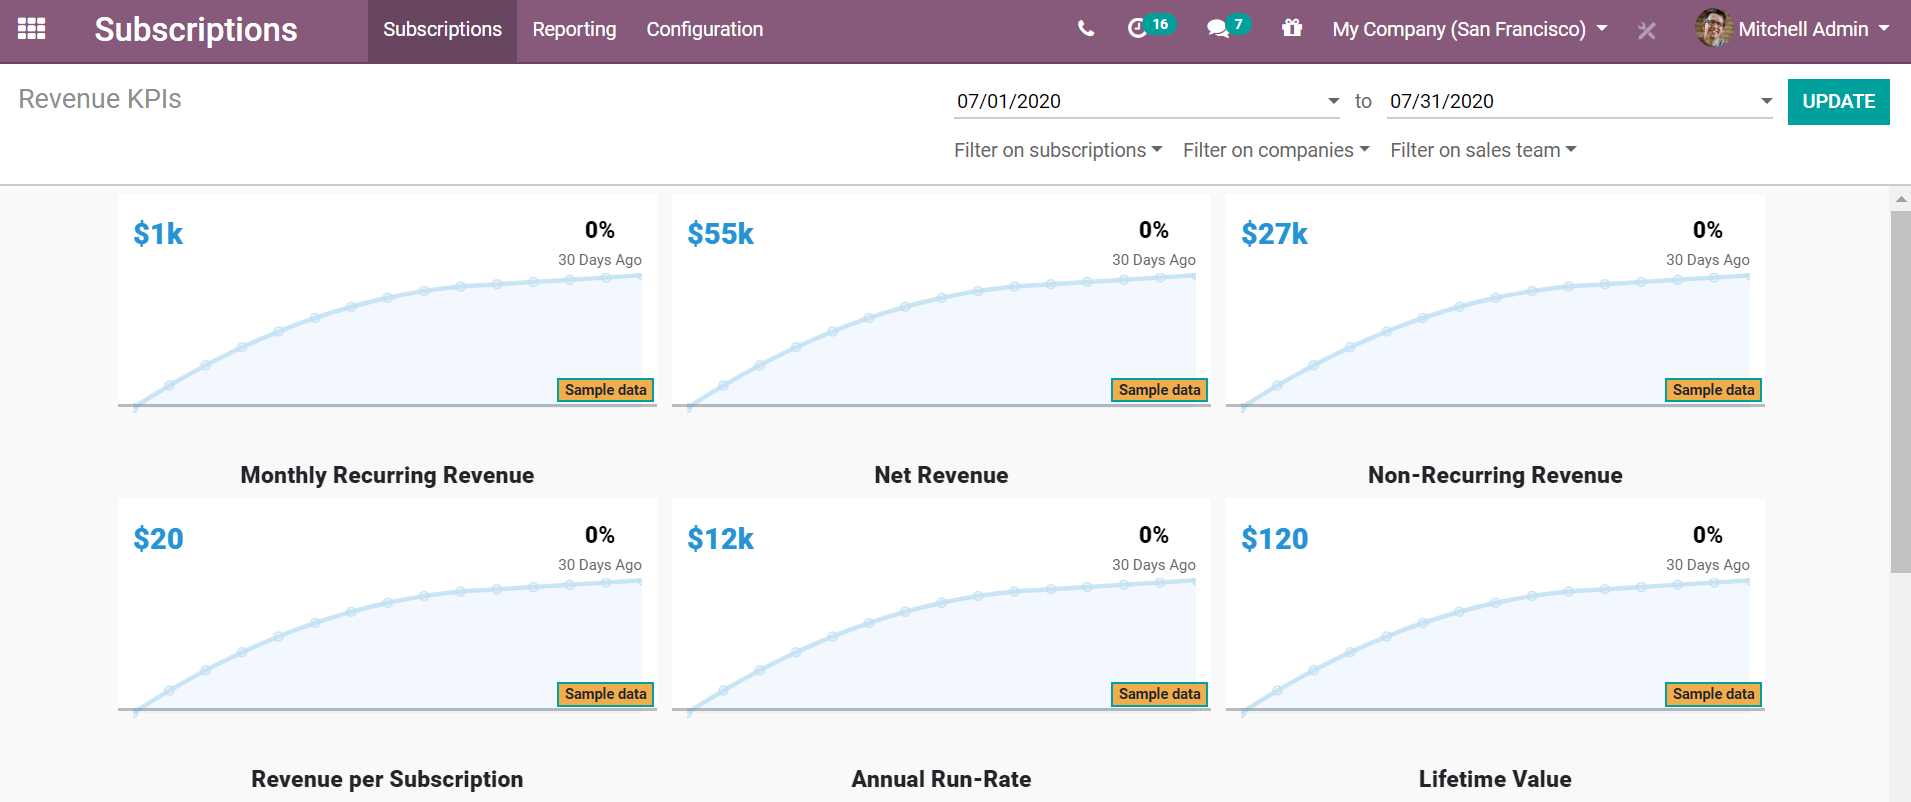
Go to . From there, you can check different KPIs: Monthly Recurring Revenue, Net Revenue, Non-Recurring Revenue, Revenue per Subscription, Annual Run-Rate, Lifetime Value, and more. You can also filter this information on subscriptions, companies, and sales teams. This is useful if you are looking for specific information.
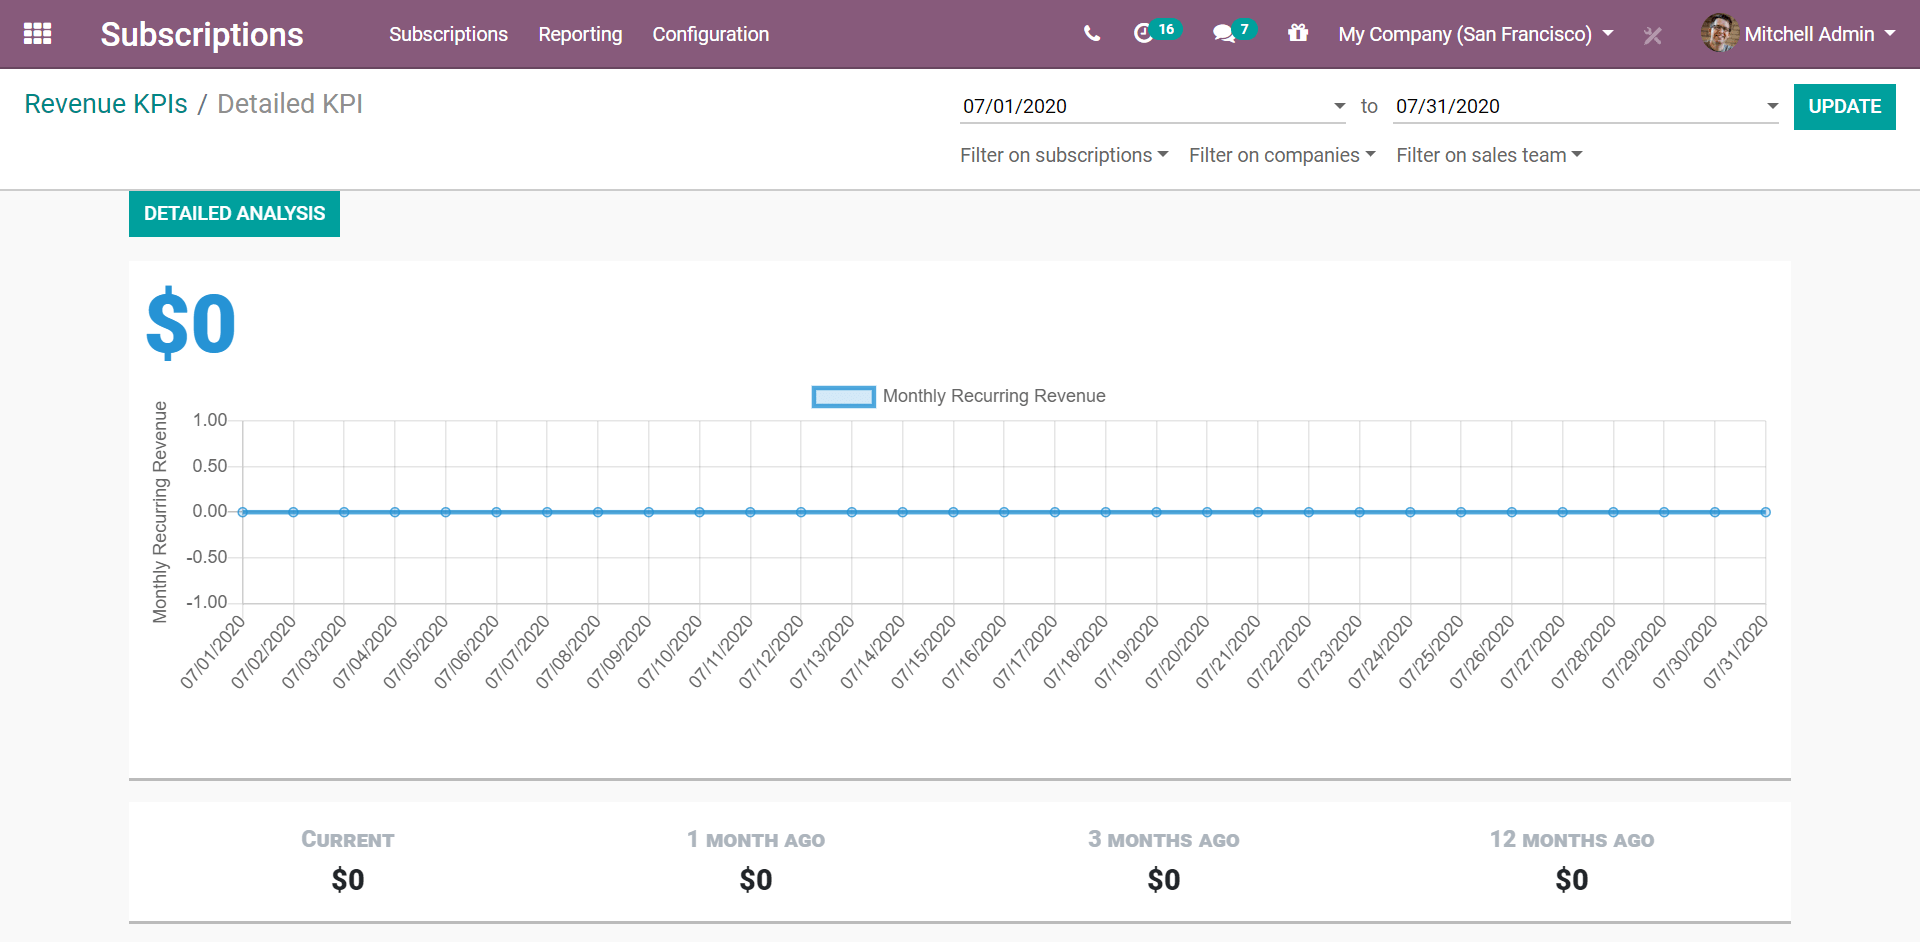
The example below shows the Monthly Recurring Revenue detailed report. At the moment, there is no data, which is the typical scenario for a new business. But, as your company grows over the months, these graphs get populated with more and more data. Once again, you can filter these specific KPIs on subscriptions, companies, and sales teams.
Salesperson dashboard report
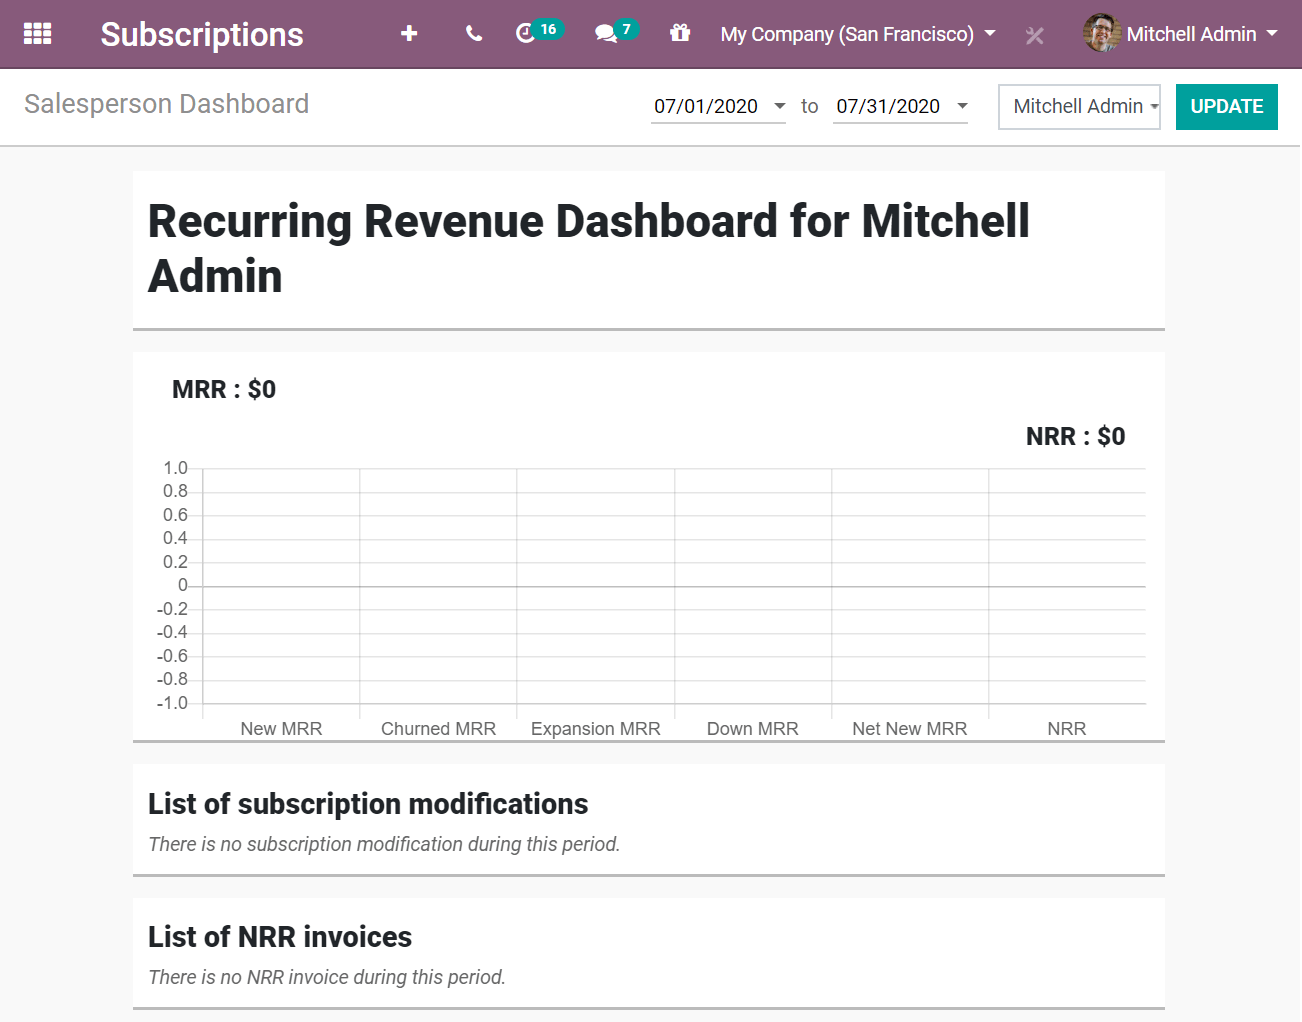
Go to . This page gives you a summary of your Monthly Recurring Revenue, Non-Recurring Revenue, Subscription modifications, and Non-Recurring Invoices for each of your salespeople. You can choose the period you want to apply and the salesperson you want to analyze.
